Founders and product managers have a lot on their plates — figuring out what to prioritize is just one item on the laundry list of startup to-dos. Luckily, the RICE scoring model can be super useful for those looking for an objective, quantifiable method of deciding what to prioritize and why.
In this article, we’ll dive into:
Not sure if the RICE model is right for your team? There are plenty of other approaches to prioritization that might work better. Check out our guide to the best product management prioritization frameworks to learn about them all.
Let’s get into RICE.
What is the RICE framework?
RICE is an acronym that stands for reach, impact, confidence, and effort. The technology company Intercom’s product management team developed it when they struggled to find a prioritization framework that best suited the project ideas on their product roadmap.
Because not all product feature ideas are of equal value, the RICE prioritization method works by calculating a score for each idea based on four factors:
- Reach: How many customers will be affected within a given time period?
- Impact: How much will the initiative move the business or customer happiness needle?
- Confidence: How certain are you about your reach and impact estimates?
- Effort: How much time will it take to complete the initiative?
This single score per feature makes it easy to sort and compare which features to prioritize before others — the higher the RICE score, the higher the priority. In this way, the RICE prioritization framework helps agile teams schedule features, projects, and development work in the product roadmap.
That said, RICE isn’t necessarily a customer delight-focused tool and won’t magically solve all of your prioritization challenges. There are lots of factors — internal and external — that ultimately influence what product features get prioritized. RICE scores simply help inform these decisions.
How are RICE scores calculated?
Here’s the basic RICE formula:
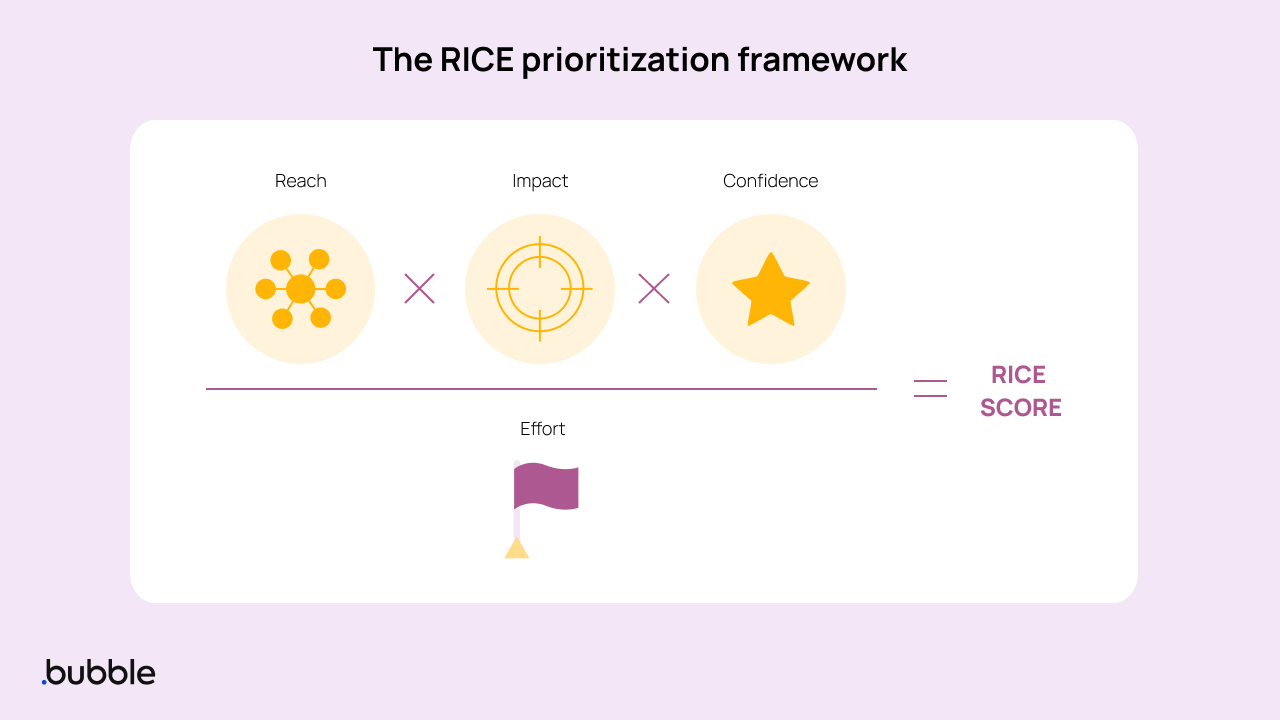
In other words, to calculate the RICE score for a given product idea, multiply the values you’ve assigned to reach x impact x confidence, then divide that by effort.
But how do you decide on each dimension’s value? Here’s how to apply a consistent framework for each one.
Reach
The value you assign to reach should quantify how many customers you think could be affected by a feature within a given time period. This time period should be the same for all the potential features you’re scoring.
- For example, let’s say you want to change a screen in your signup flow. About 100 people see this screen every month. Your reach is 100.
- Alternatively, let’s imagine you want to change a selection drop-down that receives 33% of the clicks on a page, and that page receives 180 unique views each month. Your reach would be 180 x 0.33 = ~60.
Impact
The value you assign to impact should estimate the effect your feature could have on a KPI. That KPI should be one that’s important to your team — for example, one related to business goals, customer satisfaction, or even performance. Since impact can be vague and tricky to measure, it often works best to use an impact multiplier:
- Maximum Impact = 3
- High impact = 2
- Medium impact = 1
You’ll notice there’s no “low impact” option in the list above — the idea is that if something is expected to have a low impact, it’s probably not worth investing in (at least right now). Of course, these are just suggestions — if your team thinks there’s value in modifying these multipliers or creating other categories, give it a try! The most important thing is to be consistent.
Confidence
Now comes the fun part: How confident are you in your reach and impact estimations? Give each one a value like this:
- High confidence = 100%
- Medium confidence = 80%
- Low confidence = 50%
If you have a gut feeling that a feature will create an enormous impact but you don’t have any data to support it, you might decide to assign it a low confidence value. Or, let’s say you have tons of data to support your impact estimate, but you aren’t sure how upcoming changes to your marketing strategy might impact reach — you might give it a medium confidence value. And so on.
Effort
Finally, you need to estimate effort, which is typically measured in person-time intervals — that is, the work that one team member can do in a defined period of time. Because startups (especially those built on Bubble!) move quickly, you might choose to measure things in “person-days” or “person-weeks.” Other teams may choose how to estimate effort in “person-months.” It all depends on how your team tends to work.
- Let’s say you’re a founder building on Bubble, releasing features weekly. You want to integrate a new AI tool to help answer customer questions. You’ve identified a great plugin from the Bubble plugin marketplace, so you don’t expect a steep learning curve for installation or configuration. Your effort score would be 1 person x 1 week = 1.
- Alternatively, let’s say you have a team of three Bubble Developers working on a complex application. You want to make a big change that'll require significant research and risk mitigation, and could take several weeks. Your effort score for a new project idea to overhaul this complex system could be 3 people x 6 weeks = 18.
Because effort is the denominator of the equation, the greater a feature’s estimated effort, the lower the RICE score. In this way, the RICE framework helps you make sure the potential benefits of a feature idea outweigh its potential costs.
How to create a RICE scoring model for your team
Many product management software solutions include RICE scoring tools, but it’s easy to create a RICE scoring model using a simple spreadsheet, too.
Though the RICE prioritization method is more quantifiable than many other product prioritization frameworks, there’s still plenty of flexibility in how you define the values in order to best serve your team.
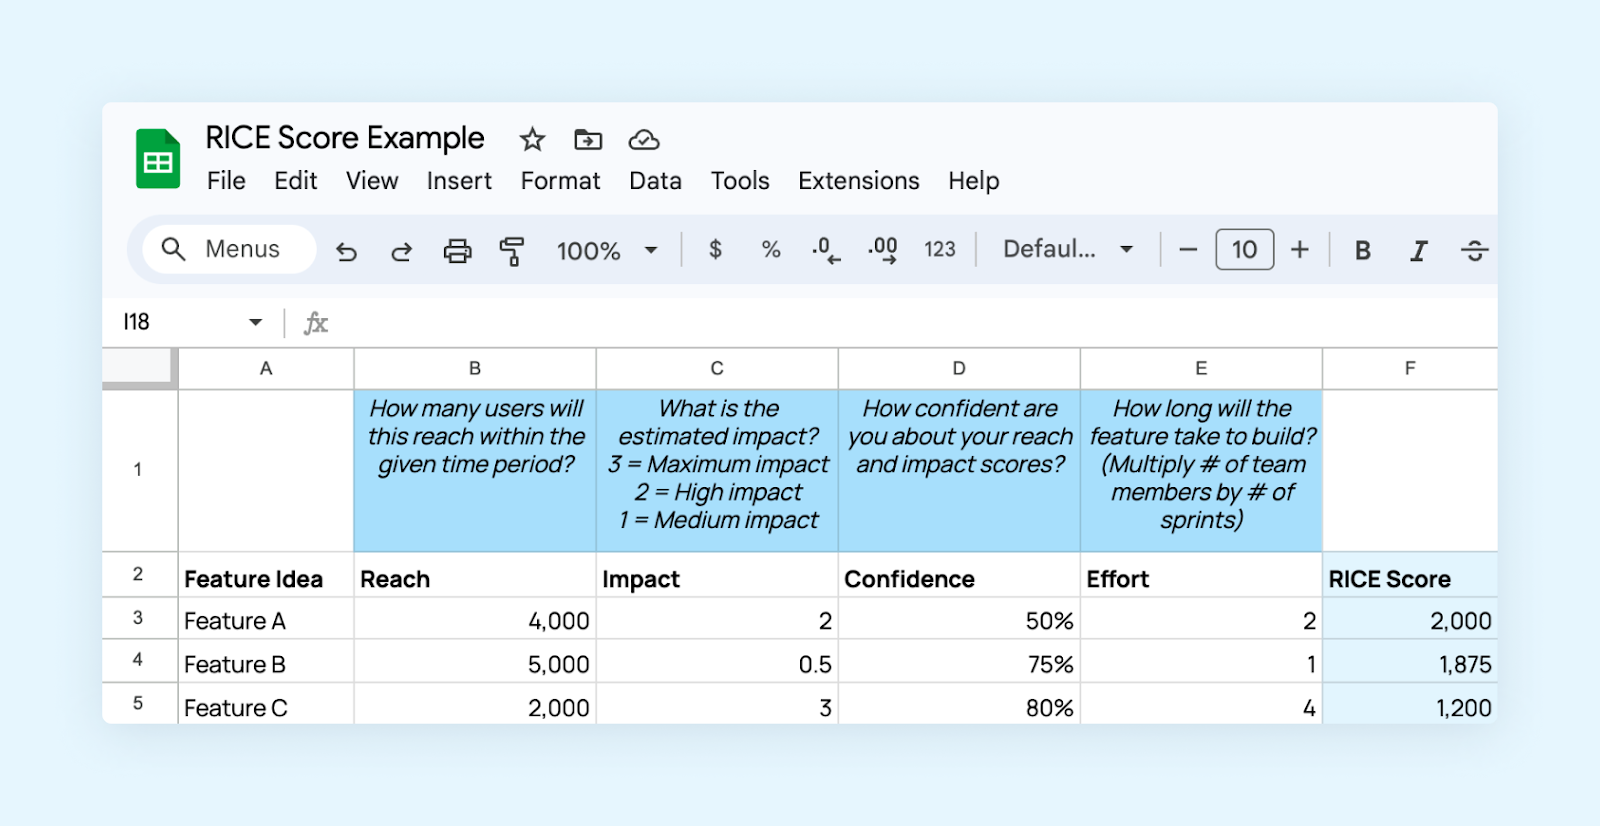
Set up a spreadsheet with column headers that articulate the feature idea, reach, impact, confidence, effort, and RICE score. It can also be helpful to add an area for notes around how to evaluate the reach, impact, confidence, and effort values to help your team avoid confusion and promote consistency. For example:
After you’ve gone through the scoring exercise for each of your feature ideas, you can compare their final scores. The higher scores should theoretically be prioritized before the lower scores. That said, what you ultimately decide to prioritize will likely include other factors — like your strategic goals, your roadmap, and other unique circumstances.
Along the way, remember: Using the RICE model effectively can take a little trial and error — and that’s OK!
RICE scoring framework example
Let’s bring it all together to see an example of the RICE framework in action.
Imagine you’re building a secondhand marketplace web app for high fashion. Here’s how you might think about calculating reach, impact, confidence, and effort for two separate features you are considering prioritizing.
Feature A: Optimizing a screen in the onboarding flow
- Reach: 100 people on average see this screen every month. Reach is 100.
- Impact: This change would be a customer delight, but may not impact conversion to the next page by much. Impact is 1 (medium impact).
- Confidence: You’re very confident this change will support customer delight, but not very confident about how it will enable conversion. You don’t have reason to believe it will hurt conversions. Confidence is 80%.
- Effort: This change will require design and animation work that will take 1 designer 1 week to design, and 1 developer half a week to implement and test. Your effort is 1 (1 designer x 1 week) + .5 (1 developer x .5 week) = 1.5.
Feature B: Adding a new payment method option at checkout
- Reach: On average, 60 people check out every month. Reach is 60.Impact: Users have asked for this additional payment method. They say it will make paying from their phones easier, resulting in them making purchases more often. Impact is 2 (high impact).
- Confidence: You’re very confident in the high impact estimate. Confidence is 100%.
- Effort: This change will take 1 developer 1 week to implement and test. Your effort is 1 (1 developer x 1 week).
Your RICE score for Feature A is 53.3, and your RICE score for Feature B is 120. Based on the RICE scoring method, you should prioritize Feature B over A.
What are the pros and cons of the RICE framework?
Teams appreciate the RICE framework because:
- It promotes cross-team collaboration
- It quantifies prioritization and decision-making so teams aren’t just relying on gut feelings or building pet ideas
- It forces difficult conversations and critical thinking
- It’s unique in that it enables teams to factor in high, medium, or low confidence estimates about their decision-making
That said, using the RICE model isn’t for all teams all the time. A few of its shortcomings include:
- It can be time-consuming to discuss, deliberate, calculate, and compare
- It can create a false sense of certainty
- It can be a little too “in the weeds” depending on a business’ growth stage and goals
- It doesn’t explicitly prioritize customer delight or customer happiness
Is the RICE framework right for you?
Using the RICE prioritization framework can require more effort than other prioritization frameworks. It doesn’t mean it’s better or worse — it’s just different. For teams looking to put numbers and data behind their decisions, the RICE model can be an excellent tool since it takes the feature ideas on the table and runs them through a consistent formula.
On the other hand, if you’re looking for a higher-level sorting method of what’s most important, you might be better served choosing a different prioritization framework like MoSCoW, Kano, or even a quick Impact x Effort matrix.
Or you can use them in tandem: Let's say you started off with the MoSCoW method to narrow down your must-have features — but that list is now ten items long. You can use RICE to calculate scores for those ten features and evaluate how important they are against each other.
Get started using RICE today
For founders, product managers, and anyone else involved in product roadmap prioritization, RICE scores can be a super valuable input to help inform feature development. Because the framework factors in multiple dimensions, it’s a helpful exercise that not only helps quantify inputs, but also forces teams to collaborate cross-functionally to calculate scores. That means you’ll have high confidence in what you’re prioritizing and why.
You likely won’t want to use the RICE model as gospel — for example, Feature A may have greater strategic value than Feature B based on a high-value customer or investor, even if it has a lower RICE score — but you can use the RICE score process to create a quantifiable equal playing field for potential features.
Ready to build? Start prioritizing and executing on your product roadmap – for free! – with Bubble. You can build faster, easier, and more affordably than ever, which means that you can prioritize more features and launch them to users more efficiently.
And if you need a helping hand, check out our agency and developer directories to explore trusted support.
Build for as long as you want on the Free plan. Only upgrade when you're ready to launch.
Join Bubble