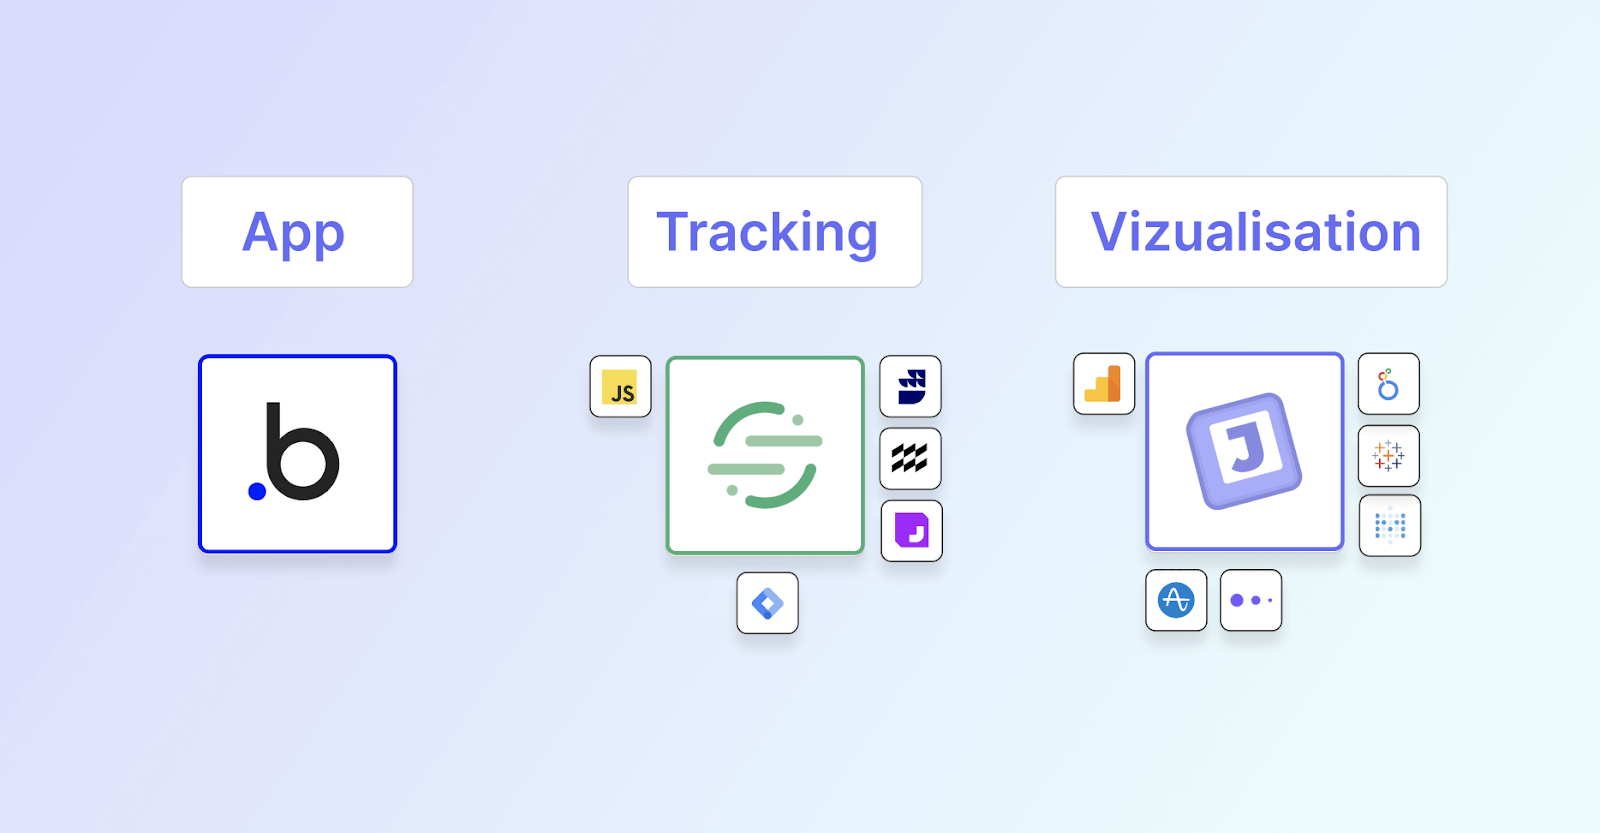
Bubble makes it possible to build a variety of apps without code. The moment your app has users, it’s already time to make improvements. When you understand how users interact with your app, you can steer improvements in the right direction. Segment’s customer data platform (CDP) can be integrated directly in Bubble, and June can make visualizing your data a breeze. With the Segment plugin for Bubble, it’s possible to collect and organize product usage data. Once set up for your web app, Segment creates a profile for every user you have and stores the actions they perform.
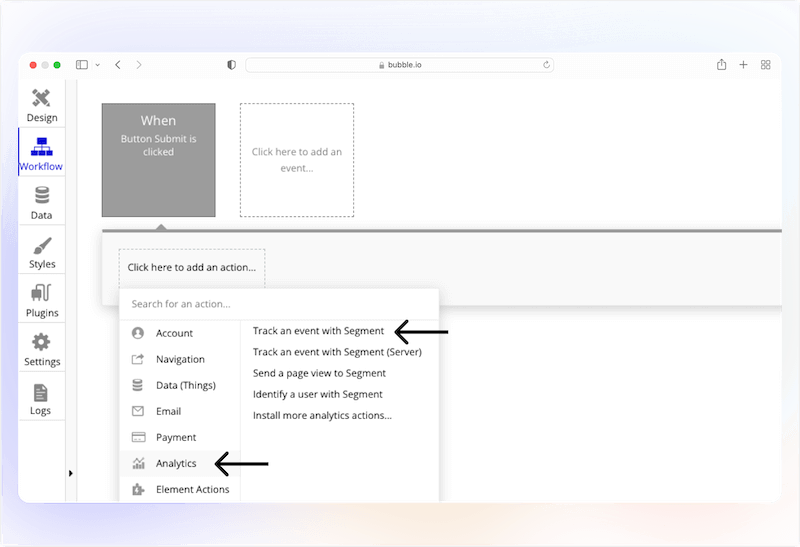
The Segment plugin allows you to track users' behaviors (called “events”) directly from the Bubble app editor. You can add an event for every core action users can do within your product, like signups, plans being purchased, friends being referred, and much more.
The key for accurate and insightful analytics is labeling and mapping key user actions in your product to an event.
To get insights from your product usage data, common best practice is using a visualization tool to save time and make drawing conclusions from data much easier. To do that, Segment allows you to distribute the data collected to several destinations, which can be used for product analytics and a variety of other cases. This is where Segment tools like June can help!
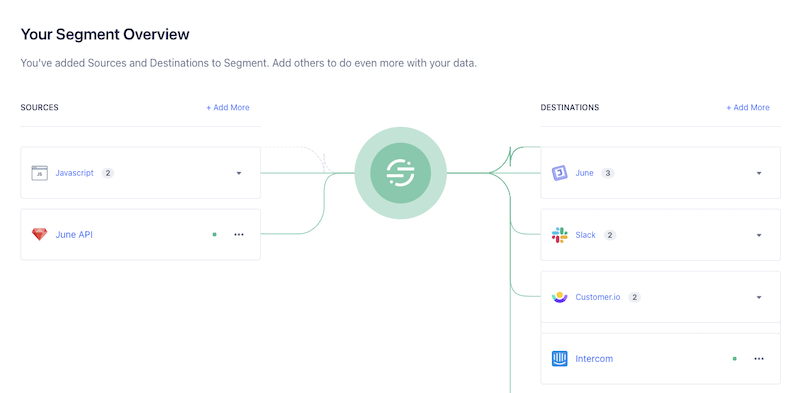
June is a no-code, plug-and-run product analytics app on top of Segment. June provides ready-made templates for monitoring important metrics, making it easier than ever to get your analytics set up and running. June is accessible as part of the Segment catalog.
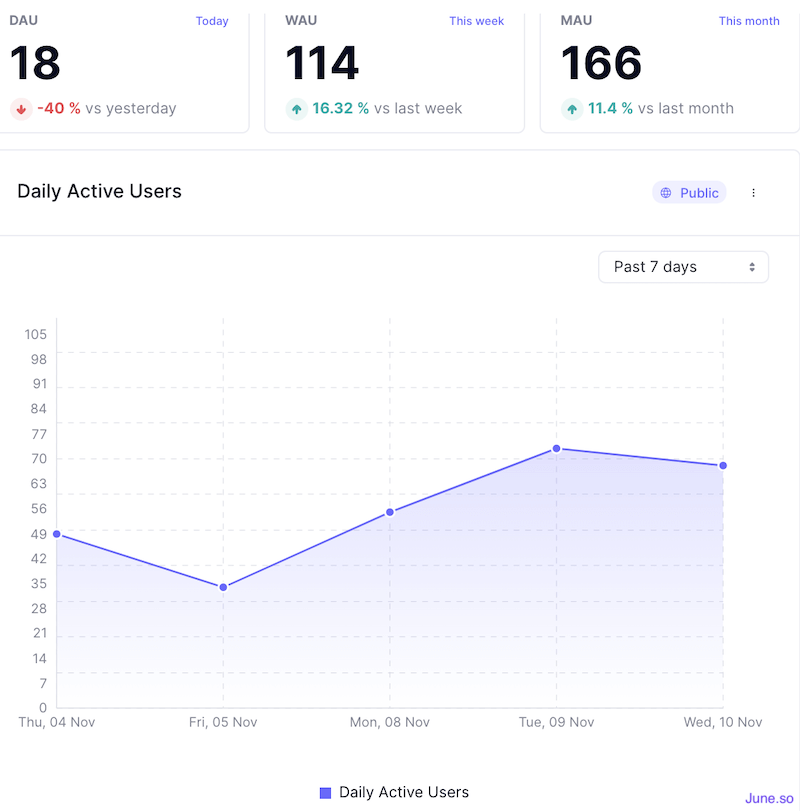
Active users
This is the most basic way of measuring user engagement and making sure you’re growing your user base in a meaningful way.
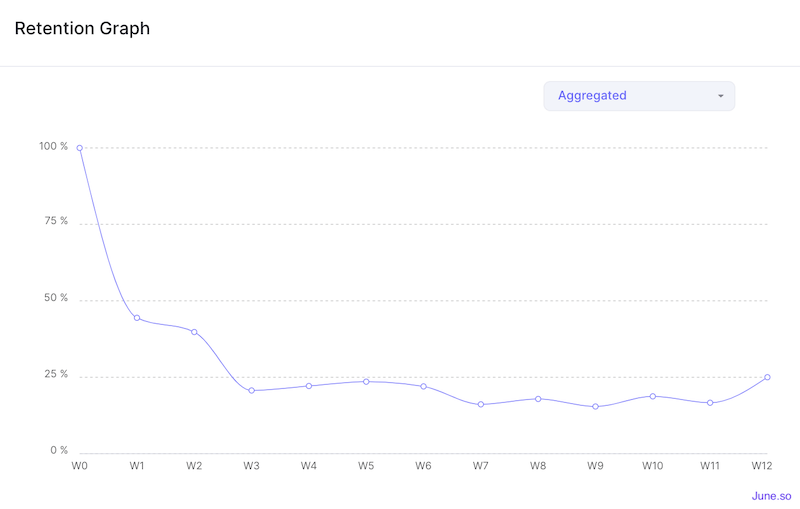
User retention
It tells you if the same users come back. Retention refers to continuous usage, which means your solution keeps generating value over time. When your business retains its users, your revenue compounds.
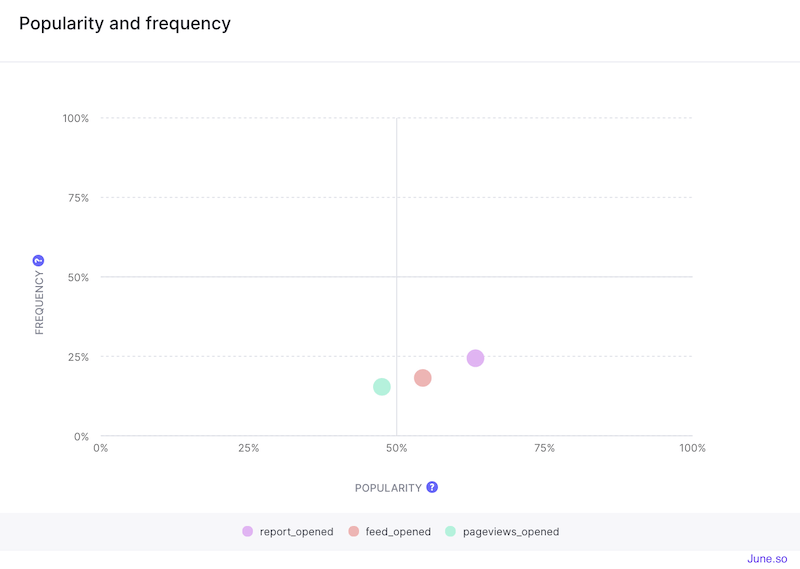
Feature Audit
Feature Audit tells you which features are being used and by what percent of your users. It helps discover which features are great and which need improvements. It’s a good indicator of what users like in your product.
To leverage event data, you can connect Segment and forward your data to your favorite data visualization tool without engineering work required. Plug-and-play analytics tools like June can get you the main analytics for your industry within a few minutes. If June sounds interesting to you, they've written a full playbook for using it in Bubble. You can find a detailed explanation to start doing product analytics on your Bubble app – without code!
If you're ready to do product analytics like a pro, get the Segment plugin for Bubble.