Whether you’re creating an internal dashboard, building a user-facing analytics app, or simply trying to illustrate a point, data visualization can be a powerful tool for conveying information.
With the :group by operator, you can define one or more groupings of data and aggregate that data based on how you want to slice and dice it. For example, you might want to group data by creation date or owner and present that data by sum or average. By using :group by, you’re able to cross-hatch your data easily and dynamically.
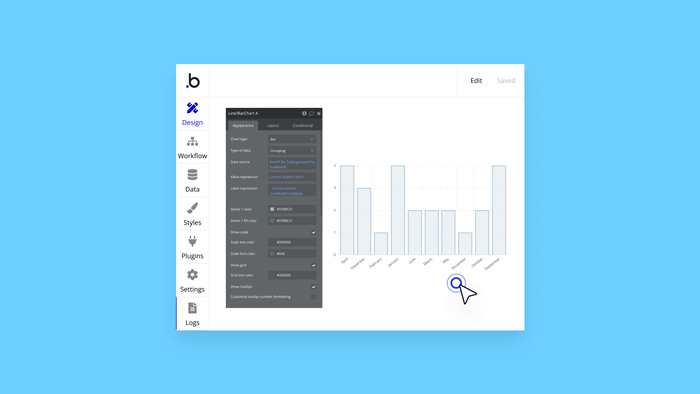
Here’s a step-by-step guide to using the :group by operator and the free Chart.js plugin to return and display data in a bar chart.
Build for as long as you want on the Free plan. Only upgrade when you're ready to launch.
Join Bubble